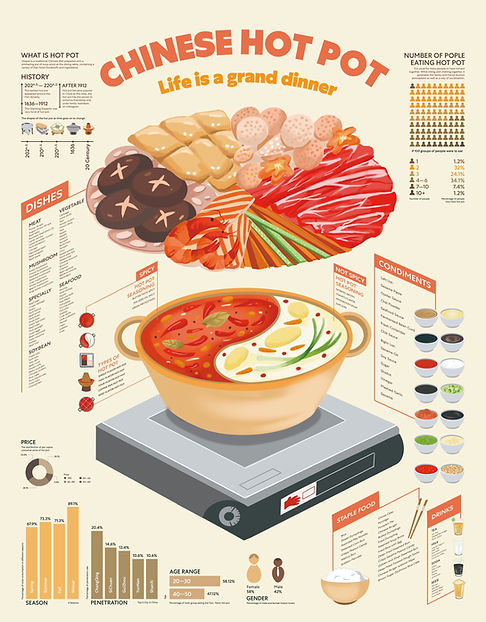
Categories: Poster, Data Visualization, Team Work
2019
Brief Process
In China, almost everyone has eaten hot pot. This is a traditional Chinese food. There are many food cultures in it, which symbolize family reunion. So our group wants to use information design techniques to display the data of hot pot so that more people know and like a hot pot. After a lot of research and investigation, we combined all the data to make the final product. In the process of research, We found that if I could use the illustration style to design the whole poster, it would attract more attention.
Design System
Typeface
Centra No1 Family
Style
Illustration, 3D
Color
CMYK
Thinking Process
Quantitative and Qualitative Research
What is the Infographic?
• Show the data
• Induce the viewer to think about the substance rather than about methodology, graphic design, the technology of graphic production, or something else
• Avoid distorting what the data has to say
• Present many numbers in a small space
• Make large data sets coherent
Analysis
The three parts of all infographics are the visual, the content, and the knowledge.
• Encourage the eye to compare different pieces of data
• Reveal the data at several levels of detail, from a broad overview to the fine structure
• Serve a reasonably clear purpose: description, exploration, tabulation, or decoration
• Be closely integrated with the statistical and verbal descriptions of a data set.
Basic Provisions
Appeal, Comprehension, Retention.
Primarily Types
Time-series data, Statistical Distributions, Maps, Hierarchies, Networking.
Brainstorming
Nonlinear


Linear
Planning
We divided this infographic design into 12 parts, introducing the history and origin, the material in a different period, price, season and the timeline for different types of food, types of pot, condiment, regional popularity, top 10 brand, hot pot broth and seasoning, staple food, dishes, drinks, age range. Each part corresponds to charts and data, there are different icons. There will be illustrations of hot pot and main types of food in the middle, which makes the whole information very clear. Readers can know the theme at first sight. Again, we’re going to show the stereoscopic sense, so we’re going to use some different orientation lines to guide the information in different areas.
Design Process
Sketches


Solution
Infographic


CHINA DAILY
Newspaper

